NVIDIA (NVDA) Stock Analysis: Is This AI Giant Ready for a Rebound After the Pullback?
NVIDIA Stock Analysis: Latest News, Technical Chart Review, and Price Outlook
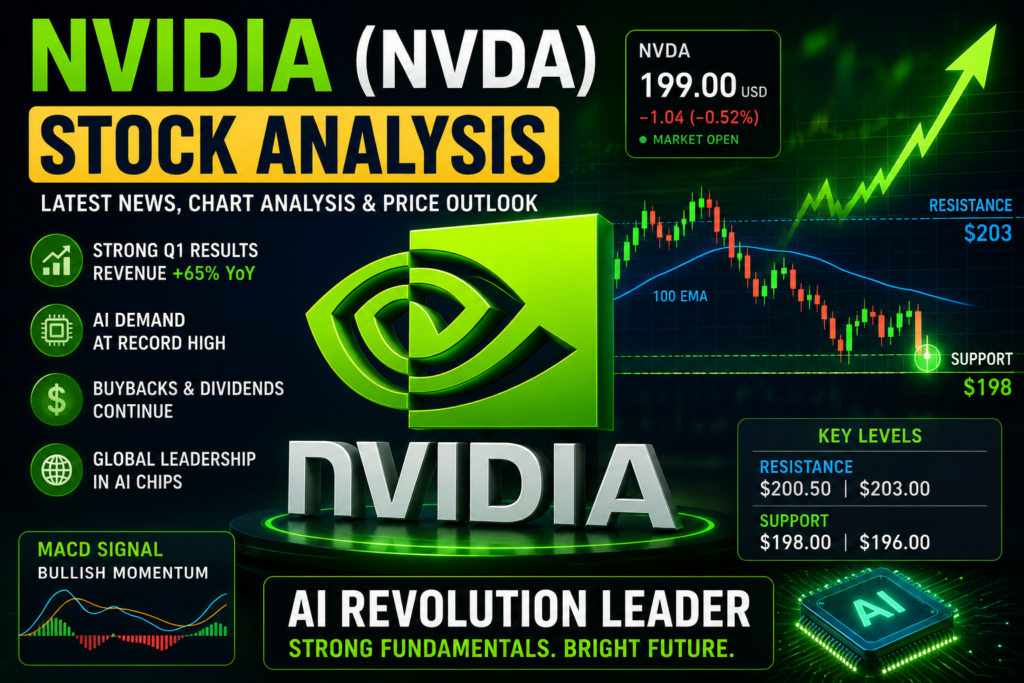
NVIDIA (NASDAQ: NVDA) remains one of the world’s most closely watched technology stocks. Even after delivering exceptional long-term returns, the stock has recently experienced a healthy correction as investors booked profits following a strong rally. Despite short-term weakness, NVIDIA continues to dominate the artificial intelligence (AI) semiconductor industry with industry-leading GPUs, expanding software platforms, and growing enterprise demand.
At the time of writing, NVIDIA is trading around $199, showing signs of stabilization after several days of selling pressure. While price action remains below the 100-period EMA on the intraday chart, buyers have started defending lower support levels, creating interest among swing traders and long-term investors alike.
This article combines the latest company developments with technical chart analysis to understand whether NVIDIA is preparing for a rebound or if further downside remains possible.
Latest NVIDIA News
Recent corporate updates continue to highlight NVIDIA’s exceptional business performance.
The company reported impressive fiscal 2026 growth with:
- Revenue growing approximately 65% year-over-year
- Earnings per share increasing nearly 67%
- Strong free cash flow generation
- Continued shareholder return through buybacks and dividends
These numbers reinforce NVIDIA’s leadership position within the AI infrastructure market.
During the latest shareholder meeting, management also discussed corporate governance, executive compensation, ESG reporting, and future investment priorities.
Another important development attracting investor attention involves increasing demand for NVIDIA AI chips in international markets. Reports suggest that limited supply and export restrictions have increased demand for certain advanced AI processors in unofficial secondary markets.
However, investors should also note that some research firms remain cautious. Concerns continue regarding customer financing, future AI spending sustainability, and large capital commitments by hyperscale cloud providers.
Although opinions differ, NVIDIA’s long-term AI leadership remains largely intact.
NVIDIA Technical Chart Analysis
Current Price Trend
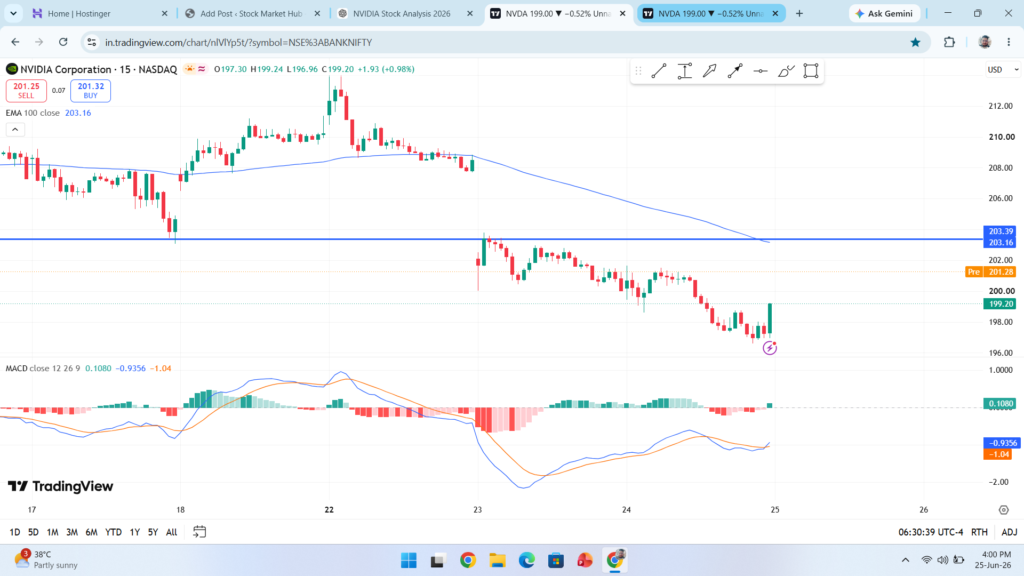
Looking at the 15-minute TradingView chart, NVIDIA remains in a short-term downtrend.
Several technical observations stand out:
- Price is trading below the 100 EMA.
- Lower highs and lower lows remain visible.
- Sellers continue controlling short-term momentum.
- However, buying interest appeared near the recent swing low around $196-$197.
The latest green candle indicates buyers are attempting a relief rally after several consecutive bearish candles.
Although this does not confirm a trend reversal, it does suggest that selling pressure has temporarily weakened.
Support Levels
Current support zones include:
Immediate Support:
- $198.00
- $197.00
Major Support:
- $196.00
- $195.50
If these levels continue holding, buyers may attempt another move higher.
A breakdown below $196 could invite fresh selling pressure toward lower price zones.
Resistance Levels
The chart also identifies several important resistance areas.
Immediate Resistance
- $200.50
- $201.50
Major Resistance
- $203.00
- 100 EMA near $203
The blue horizontal resistance around $203 is especially important.
This level previously acted as support before breaking lower. Now it may become strong resistance if price attempts to recover.
A sustained breakout above the 100 EMA would significantly improve short-term sentiment.
EMA Analysis
The 100-period Exponential Moving Average continues sloping downward.
This confirms:
- Bears remain in control.
- Trend strength favors sellers.
- Any upward move should currently be treated as a pullback until price reclaims the EMA.
Professional traders generally prefer waiting for price to move above the EMA with strong volume before confirming a bullish reversal.
MACD Analysis
The MACD indicator offers an interesting signal.
Current observations include:
- Histogram has turned positive.
- MACD line is attempting a bullish crossover.
- Bearish momentum has weakened considerably.
Although confirmation is still required, this is one of the first positive momentum signals after the recent decline.
If MACD completes a confirmed bullish crossover while price breaks above resistance, buyers could gain additional confidence.
Candlestick Analysis
The latest candle shows aggressive buying from intraday lows.
This suggests:
- Buyers defended the lower support area.
- Short-term bargain hunters entered the market.
- Sellers may be taking profits.
However, one bullish candle alone cannot reverse an established downtrend.
Traders should monitor whether additional higher highs and higher lows develop during the next trading session.
Market Sentiment
Investor sentiment remains mixed.
Bullish Factors
- Strong AI demand
- Excellent financial growth
- Industry-leading GPUs
- Massive enterprise AI investments
- Healthy cash flow
Bearish Factors
- High market expectations
- Profit booking
- Global export uncertainties
- Valuation concerns from some analysts
- Short-term technical weakness
Because of these conflicting factors, price volatility may remain elevated over the coming weeks.
Short-Term Price Prediction
Based on current chart structure:
Bullish Scenario
If buyers successfully defend $198 and push above $200.50, the stock may target:
- $201.50
- $203
- $205
A breakout above the 100 EMA would strengthen bullish momentum.
Bearish Scenario
If support around $198 fails, sellers could revisit:
- $197
- $196
- $195
Further weakness below these levels could extend the correction.
Long-Term Investment Outlook
Despite recent price weakness, NVIDIA remains one of the strongest long-term growth companies in the technology sector.
Key growth drivers include:
- Artificial Intelligence
- Data Centers
- Cloud Computing
- Robotics
- Autonomous Vehicles
- Enterprise AI
- AI Software Platforms
Major cloud companies continue investing billions into AI infrastructure, and NVIDIA remains the primary beneficiary of that spending.
Long-term investors generally focus more on business fundamentals than short-term chart fluctuations.
Risk Factors
Before investing, investors should consider:
- Market volatility
- Semiconductor competition
- Export regulations
- AI spending slowdown
- Interest rate uncertainty
- High institutional ownership
Proper risk management remains essential regardless of market outlook.
Trading Strategy
For short-term traders:
- Wait for confirmation above resistance before chasing momentum.
- Watch volume carefully during breakouts.
- Use stop-loss below nearby support levels.
- Avoid emotional trading during high volatility.
For long-term investors:
Gradually accumulating shares during healthy pullbacks may provide better risk-adjusted opportunities than buying after large rallies.
Final Verdict
NVIDIA continues to be one of the most influential companies driving the global AI revolution. While the recent correction has weakened short-term technical momentum, the company’s business fundamentals remain exceptionally strong.
The current chart shows early signs of stabilization, supported by improving MACD momentum and buyer interest near key support. However, the stock still trades below the 100 EMA, meaning bulls must reclaim important resistance before confirming a stronger recovery.
Investors should closely watch the $198 support zone and the $203 resistance area over the next few sessions. A decisive move beyond either level is likely to determine NVIDIA’s next short-term direction.
For long-term investors, NVIDIA remains a high-quality AI growth stock, while short-term traders should continue waiting for technical confirmation before taking aggressive positions.