NVIDIA Stock Analysis: Is NVDA Showing Signs of a Rebound?
NVIDIA (NVDA) remains one of the most closely watched technology stocks in the market, and recent price action is attracting attention from both short-term traders and long-term investors. Based on the latest 15-minute chart, the stock is trading near the $200 level after experiencing a notable decline from recent highs.
The chart shows that NVDA remains below its 100-period Exponential Moving Average (EMA), which is currently positioned around $205. This indicates that the broader short-term trend is still bearish. However, traders are beginning to see early signs of stabilization as the stock attempts to build support near the psychological $200 price zone.
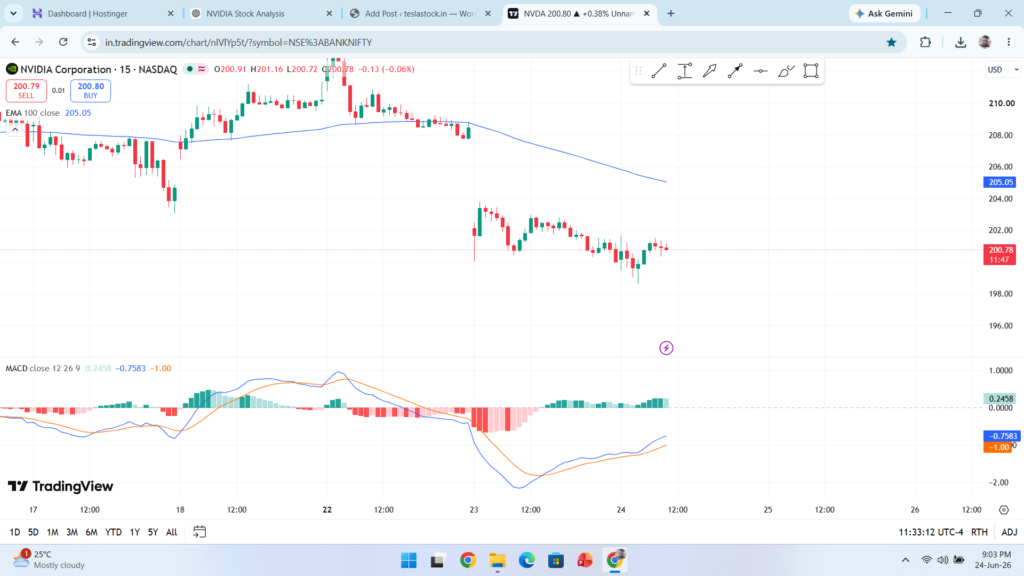
One positive signal comes from the MACD indicator. The MACD line has crossed above the signal line, and the histogram has turned positive. This often suggests that bearish momentum is weakening and buyers may be gradually returning to the market. While this does not guarantee a strong rally, it can indicate the possibility of a short-term recovery or relief bounce.
From a technical perspective, the first important resistance level is located near $202–$203. If NVDA successfully breaks above this range with strong volume, traders may look for a move toward the 100 EMA around $205. On the downside, support remains near $199–$200. A breakdown below this support could trigger additional selling pressure and potentially push the stock toward lower levels.
Investors should remember that NVIDIA’s long-term outlook continues to be supported by strong demand for artificial intelligence (AI) infrastructure, data center growth, and advanced semiconductor technology. The company remains a leader in the AI revolution, making its stock a key focus for institutional and retail investors alike.
In conclusion, NVIDIA stock is currently showing early signs of a potential short-term rebound, supported by improving momentum indicators. However, the stock remains below key moving averages, meaning confirmation of a trend reversal has not yet occurred. Traders should monitor resistance near $202–$205 and support around $200 for the next directional move.